llm-systems-manager

LLM Systems Manager

A complete, self-hosted operations platform for LLM infrastructure — monitoring, remote control, tuning, routing, alerting, and much more, all in one place.

It currently integrates llama.cpp, vLLM, LM Studio, stable-diffusion.cpp, and OpenClaw session telemetry, but the agent reports general host metrics for any Linux or macOS machine. New integrations with Ollama are on the roadmap.

Top features

1. Model Autopilot. Say which models should be available, and Autopilot keeps them that way — loading them on hardware that can actually hold them, bringing them back up somewhere else when a host drops out, and adding or removing copies as demand rises and falls. It checks a host has the memory for a model before placing it there, including hosts running on CPU alone. Defaults to off: it surfaces its proposals and changes nothing until you enable it. Lives in Admin → Routingscreenshot below.

2. OpenAI-compatible inference gateway. One endpoint on the manager fronts every backend you run — llama.cpp, LM Studio, and vLLM. /v1/models returns the merged catalog tagged by provider, and each request is routed by per-model pinning, round-robined across a pool, or failed over to another live host if a backend is down. Apps target one stable URL that looks like a single server. Streaming and non-streaming both work. See Inference gateway.

3. GPU Report Card. A standardized benchmark that produces one shareable card: time-to-first-token, prefill and generation throughput, tokens/joule, and measured $/Mtok, alongside the GPU and VRAM it ran on. The same preset runs against llama.cpp, LM Studio, and vLLM, so numbers are comparable across providers and across machines.

4. Energy and cost intelligence. Measures what inference actually costs in $/Mtok, with a monthly-savings comparison against hosted-API pricing and idle-power accounting so unused hardware is attributed honestly. A per-host performance manager also switches the CPU governor and cooling/fan profiles to match load — full performance while a model is working, quiet and low draw when it goes idle or sleeps. Screenshot below.

5. Benchmarking and autotuning built in. Run throughput benchmarks across every model in your library, and let the autotuner search for the best context/slot configuration on llama.cpp or the largest safe max-model-len on vLLM. Each model ends up tuned to the hardware it actually runs on.

6. Model management with profiles, cards, and cache control. Browse and pull models straight from Hugging Face, then prune individual files to reclaim disk. Every model keeps multiple named config profiles (e.g. chat / code / general); switching profiles from the model card reloads the running model with those settings in one click.

7. Remote control of the whole infrastructure. Start/stop/restart inference servers, hot-swap models, edit per-model configurations, update and configure llama.cpp, tail logs, or open an in-browser terminal — for any host, from one page. A Discord bot exposes the same host queries, model load/unload, and alarm acknowledgement as slash commands. One cross-platform agent covers Linux and macOS/Apple Silicon, auto-detects what each box runs, with per-agent selection. An LLM Overall view rolls multiple host metrics into one pane.

8. LLM-aware telemetry and alerting. Live metrics from the inference server include slots, tokens/sec, prompt-processing, KV cache, and context, plus system and GPU/PSU/UPS/cooling metrics. A standalone alarm engine stores every sample, evaluates threshold and anomaly rules, notifies over email/toast/webhook/Discord, buffers to disk and replays when the network returns, and collapses a burst of related issues into single incidents.

Also included: multi-user roles + admin audit log, encrypted scheduled backups, OpenClaw cost/budget analytics, an image generation tab, and TLS/mTLS on every connection — see the full feature list below.


Screenshots

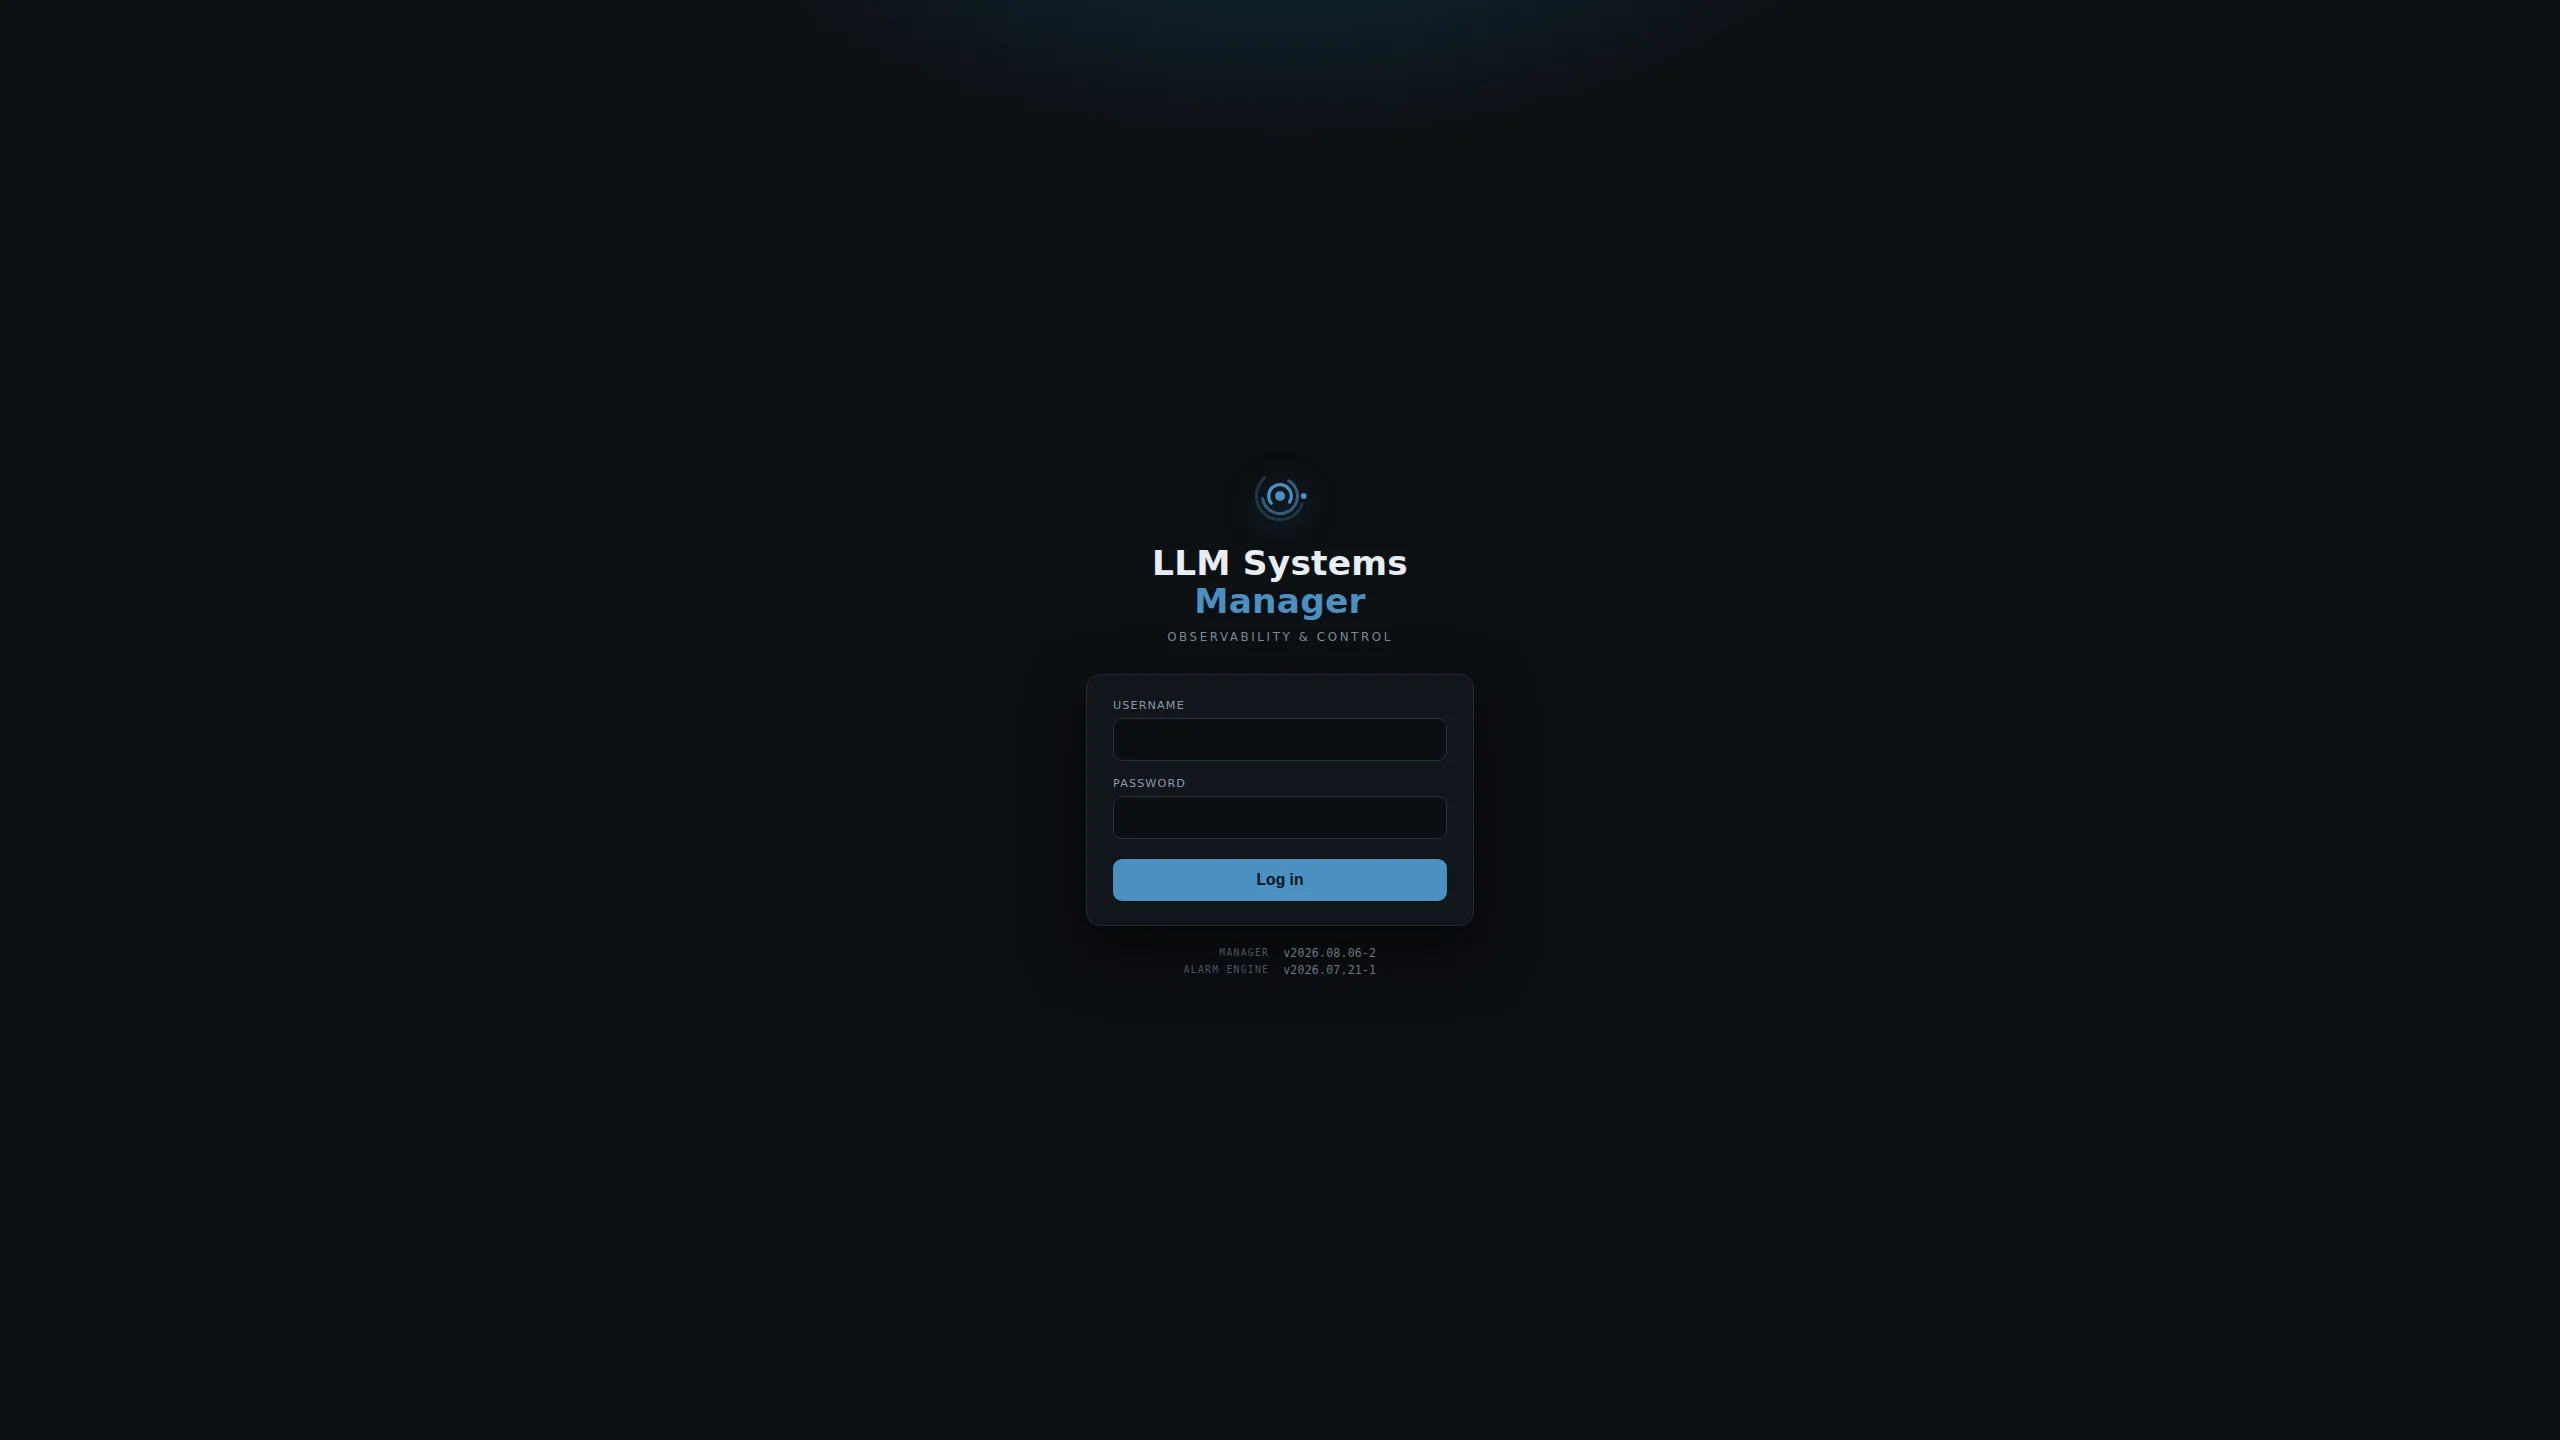
Login screen

Llama dashboard — live metrics from the llama.cpp server and its host. Llama dashboard

LM Studio dashboard — the server card, loaded models, and host metrics, plus live Apple-silicon powermetrics (SoC / CPU / GPU / ANE watts, thermal pressure, GPU busy). Token counts are measured at the manager gateway. LM Studio dashboard

Energy & cost — measured $/Mtok against your electricity price, savings versus hosted-API pricing, and hourly active-vs-idle energy. The per-host table marks which hosts report power and token telemetry, so the totals say what they’re based on. Energy and cost dashboard

Model control — start/stop inference servers, change models, control the provider, manage the model library, run benchmarks, auto tune models. Model control Model control detail Model control cards

Autotune & benchmark — search for the fastest context/slot settings per model and benchmark your whole model library. Autotune wizard Benchmark results

OpenClaw dashboard — OpenClaw session metrics, cost analytics, and tool attribution. OpenClaw dashboard

Manager dashboard — view overall manager and agent health. Manager dashboard

Alarm engine — trend graphs, rule and notification editor, alert timeline. Alarm engine

Admin console — system health plus sub-tabs for access control, agents, the audit log, backup/restore, and routing. The agents view lists every registered host with its capabilities, pool membership, TLS state, and version. Admin console — agents

Routing & Model Autopilot — per-provider pool order and model pins, and the Autopilot editor: one row per model with its placement, failover mode, replica range, and size, each showing whether it is currently placed. Pending proposals are listed below for approval. Admin console — routing and Model Autopilot


Full included features

The eight headline capabilities plus everything else that ships in the box:

Donations

If you find this project useful, please consider leaving a donation

Buy Me A Coffee

Installation options

The fully automated script installer (Quickstart below) is the preferred path — it handles prerequisites, InfluxDB, config, TLS, agents, and updates end-to-end. The alternatives cover specific scenarios:

Method Best for
Script installer (preferred) Everything: full stack, split installs, agents, offline installs, updates — see Quickstart
Native packages (.deb/.rpm) Hosts standardized on apt/dnf package management
Docker Compose Containerized control plane (manager + alarm engine + InfluxDB)
Homebrew brew-managed hosts (macOS Apple Silicon, Linux x86_64/arm64) — agent and control-plane formulas, auto-updating
Agent binary tarball Agent-only hosts without Python (Linux/macOS), manual layout control

Quickstart — single host

For a quick installation on one host, choose the full install option:

bash <(curl -fsSL https://raw.githubusercontent.com/llmsyscore/llm-systems-manager/main/tools/installer/install.sh)

The installer is interactive: it prompts for SMTP credentials (if you want email alerts), the manager admin login, and confirms before installing system packages. It then enables the systemd units but does not start anything automatically — it prints the exact systemctl start commands so you stay in control of timing.

The installer deploys the latest GitHub Release — a source tarball whose SHA-256 checksum is verified before anything is installed; a mismatch aborts. To pin a specific version, or to track the development tip from a git clone of main instead (the advanced/bare-metal path — code that hasn’t been cut into a release yet):

# pin a specific release
bash <(curl -fsSL https://raw.githubusercontent.com/llmsyscore/llm-systems-manager/main/tools/installer/install.sh) --ref v1.0.0

# track unreleased main (advanced)
bash <(curl -fsSL https://raw.githubusercontent.com/llmsyscore/llm-systems-manager/main/tools/installer/install.sh) --source git

The same --ref / --source flags apply to every install mode and to --update.

Offline / air-gapped install

Hosts with no access to GitHub can install from a release tarball staged out-of-band. On a connected machine, download llm-systems-manager-<tag>.tar.gz from the Releases page (verify it against the published .sha256 yourself — the offline path trusts the tree you hand it). Copy it to the target host, then:

tar -xzf llm-systems-manager-v1.0.0.tar.gz
sudo bash llm-systems-manager-v1.0.0/tools/installer/install.sh --source local

--source local installs the extracted tree the script lives in: no release download, no git clone, no installer self-update (git itself is not required on the target host). It works with every install mode and with --update (offline update of an existing install). Note the scope: only GitHub access is eliminated — installing system packages and the Python virtualenvs still uses apt and pip, so a fully air-gapped host needs local mirrors for those (or pre-provisioned dependencies).

After install:

  1. Start the services if they were not started at installation, the commands to start them will be shown by the installer.
  2. Open http://<this-host>:5000/ in a browser. Log in with the admin credentials you set.
  3. From the Admin tab, approve any agents that have registered. Approval issues each agent a per-host TLS certificate and unlocks remote control.

That’s it for a single-host lab. Everything else below is for adding more hosts or pointing the dashboard at inference servers you already run.

Docker Compose (control plane only)

Prefer containers? No repo checkout needed — curl down docker-compose.yml + .env.example, fill in the secrets, and docker compose up -d brings up the manager + alarm engine + InfluxDB from multi-arch images published to ghcr.io on every release — see docker/README.md. Agents still install natively on each host (they need sensor/GPU/systemd access).

Native packages (.deb / .rpm)

Every release also ships native packages for Debian/Ubuntu and RHEL-family distros: llm-systems-manager (manager + alarm engine; InfluxDB stays external — declared as a Recommends, with a pointer printed if it’s unreachable) and per-arch llm-systems-agent packages built around the self-contained binary:

sudo apt install ./llm-systems-manager_<version>_all.deb        # debconf prompts for admin login + SMTP
sudo dnf install ./llm-systems-manager-<version>-1.noarch.rpm   # EL9 needs python3.11 first; defaults, then edit config
sudo apt install ./llm-systems-agent_<version>_amd64.deb        # agent; prompts for the manager URL

Packages create the llmsys user, install + start the systemd units, and build the Python venvs at install time (network to PyPI required; the agent package needs none — it’s a single binary). Config survives upgrades; apt purge removes everything the package created (state from another install method is kept). Install methods don’t mix — packages and the script installer refuse to overwrite each other. Details, RPM variants, and uninstall behavior: docs/DEPLOYMENT.md.

Homebrew (control plane)

The manager and alarm engine also install from the project’s Homebrew tap — macOS (Apple Silicon) or Linux:

brew tap llmsyscore/tap
brew trust llmsyscore/tap        # newer Homebrew requires trusting third-party taps
brew install llm-systems-manager llm-systems-alarm-engine influxdb@2 influxdb-cli

Each formula builds its own Python venv from the release source tarball. Shared config is seeded at $(brew --prefix)/etc/llm-systems-manager/llm-systems.toml (alarm-engine ingest/management tokens pre-generated); state lives under $(brew --prefix)/var/llm-systems-manager/ and survives upgrades. Bring the stack up in this order — the manager’s first boot creates the internal CA and issues the alarm engine’s TLS cert:

llm-systems-influx-setup        # onboards InfluxDB, creates the buckets + scoped
                                # tokens, and writes [influxdb.tokens] into the config
brew services start llm-systems-manager
brew services start llm-systems-alarm-engine

llm-systems-influx-setup (installed by the manager formula) needs both influxdb@2 (the v2 server — Homebrew’s plain influxdb formula is InfluxDB 3.x, whose API this stack does not speak) and influxdb-cli (the influx command ships separately). To do it by hand instead: brew services start influxdb@2, influx setup, create the buckets/tokens, and fill [influxdb.tokens] in the TOML.

brew upgrade tracks new releases automatically (the same tap cron that bumps the agent formula bumps these). The dashboard is at http://<host>:5000; the alarm engine can run without InfluxDB, but history and alert evaluation stay degraded until the tokens are filled in.


Agent installation

The agent is what pushes all data into the dashboard. Run the installer and use the mode 5 (agent installation) option on every machine you want to monitor and control (Linux or macOS):

bash <(curl -fsSL https://raw.githubusercontent.com/llmsyscore/llm-systems-manager/main/tools/installer/install.sh)

The agent registers itself with the manager on first launch. From Admin → Agents, click Approve — the manager signs a TLS cert for that agent and starts polling it.

Homebrew (macOS / Linux)

On macOS (Apple Silicon) or a Linux host with Homebrew (x86_64 or arm64), install the agent from the project’s Homebrew tap:

brew tap llmsyscore/tap
brew trust llmsyscore/tap        # newer Homebrew requires trusting third-party taps
brew install llm-systems-agent

The formula picks the right prebuilt binary for the platform. Set MANAGER_URL in $(brew --prefix)/etc/llm-systems-agent/agent_config.yaml (the fully documented agent_config.yaml.example is installed alongside it for reference), then run the agent as a service (launchd on macOS, a systemd user unit on Linux):

brew services start llm-systems-agent

brew upgrade llm-systems-agent picks up new releases automatically — a scheduled job in the tap tracks each GitHub Release and bumps the formula. The dashboard’s Admin → Agents → Update self-update also works, but a later brew upgrade replaces the binary again, so prefer brew on Homebrew-managed hosts. Uninstall with brew services stop llm-systems-agent && brew uninstall llm-systems-agent.

Agent binary (no Python required)

Every release also ships the agent as a per-platform tarball (llm-systems-agent-linux-x86_64.tar.gz, -linux-arm64.tar.gz, -macos-arm64.tar.gz) with a .sha256 checksum — no Python or venv needed on the host. Each tarball bundles the self-contained binary, a fully documented agent_config.yaml.example, and the platform’s service-manager unit (llm-systems-agent-binary.service.tmpl on Linux, com.llm-systems-agent-binary.plist.tmpl on macOS), so one download + extract gives you a ready-to-edit install. On Linux:

sudo mkdir -p /opt/llm-systems-agent && cd /opt/llm-systems-agent
sudo curl -fsSLO https://github.com/llmsyscore/llm-systems-manager/releases/latest/download/llm-systems-agent-linux-x86_64.tar.gz
sudo curl -fsSLO https://github.com/llmsyscore/llm-systems-manager/releases/latest/download/llm-systems-agent-linux-x86_64.tar.gz.sha256
sha256sum -c llm-systems-agent-linux-x86_64.tar.gz.sha256   # macOS: shasum -a 256 -c <file>.sha256
sudo tar -xzf llm-systems-agent-linux-x86_64.tar.gz         # -> binary + agent_config.yaml.example + .service.tmpl
sudo chmod +x llm-systems-agent
sudo cp agent_config.yaml.example agent_config.yaml         # then edit: at minimum set MANAGER_URL
sudo chown -R <run-as-user>: /opt/llm-systems-agent

Then install the systemd unit from the extracted llm-systems-agent-binary.service.tmpl (substitute ${AGENT_USER}, ${AGENT_GROUP}, ${AGENT_INSTALL_DIR}) into /etc/systemd/system/llm-systems-agent.service and systemctl enable --now llm-systems-agent.

Provider flags (LLAMA_ENABLED, LMS_ENABLED, sudo wrappers for service control, udev rules for liquidctl) are what the full installer automates — every option is documented inline in agent_config.yaml.example, so set them in your copied agent_config.yaml as needed.

On macOS, download the -macos-arm64.tar.gz tarball instead; it bundles the same binary + agent_config.yaml.example plus the com.llm-systems-agent-binary.plist.tmpl launchd unit. Clear the quarantine attribute first (xattr -d com.apple.quarantine llm-systems-agent), then use the extracted com.llm-systems-agent-binary.plist.tmpl (substitute ${AGENT_USER}, ${AGENT_USER_HOME}, ${AGENT_INSTALL_DIR}) as the launchd unit. Linux binaries need glibc 2.35+ (Ubuntu 22.04 / Debian 12 or newer).

Binary agents built from this release onward can also be upgraded from Admin → Agents → Update: the agent downloads the latest release tarball for its platform, verifies the .sha256, extracts and smoke-tests the staged binary, swaps it atomically (previous binary kept beside it as .self-update.bak.<ts>), and restarts. Older binaries still need one manual replacement first.

Approve a second agent that runs the same provider (e.g. a second llama.cpp box) and a host picker automatically appears on the matching dashboard sub-tabs — every approved agent is independently viewable and controllable. One agent is the default (what the dashboard shows when you haven’t picked); set it from Admin.

Multiple Hosts

Typical lab topology:

                ┌─────────────────────┐
                │  Manager + Alarm    │  
                │  Engine + InfluxDB  │  
                │  + local agent      │
                └──────────┬──────────┘
                           │
        ┌──────────────────┼──────────────────┐
        │                  │                  │
   ┌────▼─────┐      ┌─────▼────┐       ┌─────▼────┐
   │  GPU     │      │  Mac     │       │  Other   │
   │  host    │      │  Studio  │       │  hosts…  │
   │  agent   │      │  agent   │       │  agent   │
   │  +llama  │      │  + LMS   │       │          │
   └──────────┘      └──────────┘       └──────────┘

When you want the InfluxDB on its own host, use mode 6 (InfluxDB only) option there first, then choose mode 2 (Manager + alarm) on the manager/alarm-engine host. The installer will prompt for the InfluxDB URL and the Influxdb tokens that were printed during the InfluxDB installation.

When you want the manager and alarm engine on separate hosts, use mode 3 (manager only) on the manager hose and mode 4 (alarm engine) on the alarm engine host.

The installer will prompt for the cross-host URLs and then gives you the exact commands required to copy the alarm engine’s TLS certs from the manager host to the alarm engine host.

Choosing the run-as user

By default the manager and alarm engine run as a dedicated llmsys system account (auto-created, password-locked). Passing --user <name> to the installer allows you to use a different account, you can also enter the account name during the installation as well:

If the account exists, its real primary group is preserved; if it doesn’t, the installer creates it as a system user. The agent installer also accepts the same --user flag.


Pointing the agent at your own services

The agent ships with sensible defaults and attempts to automatically configure itself. If your inference servers run on different ports, hosts, or paths, you can override them in the agent/agent_config.yaml file on each agent host (the installer drops a template alongside the agent).

Common keys:

Key What it points at Default
LLAMA_API_URL Your llama-server HTTP endpoint http://localhost:8080
LMS_API_URL Your LM Studio API endpoint http://localhost:1235
LLAMA_BIN Path to the llama-server binary (only needed for the agent’s auto-restart / config-edit flows) auto-detected
LLAMA_CONFIG_INI Path to config.ini driving llama-server auto-detected
LLAMA_LOG_FILE Path to llama-server.log (for log-tail + state detection) auto-detected
LLAMA_BUILD_METHOD How the “Update llama.cpp” button installs/upgrades: custom_script / source / release_binary / conda / homebrew auto-detected at install
LMS_CMD Path to the lms CLI auto-detected (which lms)
PROCESS_WATCHLIST Process names the agent should report on (psutil-style) sensible defaults — see the example

The installer fills most of these in at deploy time via auto-detect and prompts; the file above lists what to override after installation. Any field can also be set via environment variable LSA_<NAME> (e.g. LSA_LLAMA_API_URL=http://...).

Enable only what’s relevant — the agent installer offers --enable-llama, --enable-lms, and --enable-perf flags, and auto-detects most of these from what’s installed on the host.

A host with neither llama-server nor LM Studio just reports generic system metrics.


Inference gateway

One OpenAI-compatible endpoint (http://:5000/api/gateway/v1) on the manager serves every approved agent across all three providers — `llama.cpp`, LM Studio, and vLLM. Instead of targeting one backend by host:port, your apps call the manager and it picks a healthy one for each request:

GET /v1/models returns the merged catalog from every pool, each entry tagged with its provider and deduplicated by id, and the owning provider is resolved per request from the model you ask for. Provider-scoped twins (/api/gateway/llama/v1/*, /api/gateway/lms/v1/*, /api/gateway/vllm/v1/*) are available when you want to force one.

Routing follows the same precedence as the dashboard: a per-model pin first, then an explicit ?agent= pick, then pool round-robin, finally the system default. If the chosen backend can’t be reached, the gateway fails over to the next live agent that actually serves that model. Both streaming ("stream": true) and non-streaming requests work, and each response carries an X-Proxied-To header naming the agent that served it.

Access. By default the gateway is reachable from a logged-in dashboard session only. To let external OpenAI-SDK clients in, add one or more keys to [manager.gateway].api_keys in config/llm-systems.toml and restart the manager — each key is a bearer accepted only on /api/gateway/*:

[manager.gateway]
enabled = true
api_keys = ["sk-your-secret-key"]   # empty = dashboard-session access only
read_timeout_s = 600.0              # generation can take minutes on big models

Call it like any OpenAI endpoint:

from openai import OpenAI

client = OpenAI(
    base_url="http://<manager-host>:5000/api/gateway/v1",
    api_key="sk-your-secret-key",       # any configured key
)
resp = client.chat.completions.create(
    model="<model-id>",                 # from GET /v1/models; drives pin routing
    messages=[{"role": "user", "content": "Hello!"}],
)
print(resp.choices[0].message.content)

or with curl:

curl http://<manager-host>:5000/api/gateway/v1/chat/completions \
  -H "Authorization: Bearer sk-your-secret-key" \
  -H "Content-Type: application/json" \
  -d '{"model":"<model-id>","messages":[{"role":"user","content":"Hello!"}]}'

The gateway forwards over the existing bearer + TLS agent channel, and admin/control endpoints are never exposed. Serving LM Studio through the same gateway is on the roadmap.


Architecture

                              ┌────────────────────────┐
                              │       Browser          │
                              │  (single-page dash)    │
                              └───────────┬────────────┘
                                          │ HTTP / SSE / WebSocket
                                          ▼
                              ┌────────────────────────┐
                              │   Manager (Flask)      │
                              │  • UI + REST API       │
                              │  • Reverse proxies     │
                              │  • Agent registry      │
                              │  • Internal CA (mTLS)  │
                              └─┬──────────────────┬───┘
                  proxies       │                  │  forwards control
                                │                  │
                 ┌──────────────▼────────┐    ┌────▼────────────────┐
                 │   Alarm Engine        │    │  Agents (FastAPI)   │
                 │   (FastAPI)           │    │  TLS, bearer auth   │
                 │  • Ingests metrics    │◀───┤  • Host telemetry   │
                 │  • Rule evaluation    │    │  • llama / LMS ctrl │
                 │  • Notifications      │    │  • PTY + log tail   │
                 │  • WebSocket → UI     │    │  • Disk buffer      │
                 └──────────────┬────────┘    └─────────────────────┘
                                │
                       ┌────────▼─────────────┐
                       │   InfluxDB v2        │
                       │  metrics time-series │
                       │  (raw + rollups)     │
                       ├──────────────────────┤
                       │   SQLite (WAL)       │
                       │  alerts · rules ·    │
                       │  channels · history  │
                       └──────────────────────┘

The three services

Service Role Where it runs
Manager Web UI, REST API, reverse proxies for sub-services, agent approval, internal certificate authority, layout/state persistence. One Linux host.
Alarm Engine Ingests every metric sample, persists to InfluxDB, evaluates rules, fires/acks/resolves alerts, dispatches notifications, streams events to the UI over WebSocket. Same host as the manager, or its own server.
Agent Lives on every monitored host. Polls the kernel, sensors, GPU, llama.cpp, LM Studio. Buffers samples to disk if the network is down. Exposes a TLS-only API for remote control. Every host you want to monitor.

How a metric travels

  1. The agent samples the host every few seconds, builds a flat JSON sample, and pushes it via a buffered client to the alarm engine.
  2. The alarm engine writes the sample into InfluxDB, evaluates active rules, and — if a threshold trips — fires an alert through the notification dispatcher.
  3. The browser keeps a WebSocket open to the alarm engine for alert state, and polls the manager for live metrics. The frontend dashboard renders both.

Storage

InfluxDB v2 is the database for the time-series metrics — raw samples plus a one-minute rollup for long-range history. Everything transactional lives in SQLite (WAL mode, owned by the alarm engine): alerts and alert history in one database, alarm rules / notification channels / notification policies / delivery history in another. A separate small SQLite file beside the manager holds one secondary table for per-model benchmark averages. UI state (card order, theme) lives in a JSON file beside the manager.

Security model

Frontend

The frontend polls the manager every few seconds when something is active and slows down when the lab is idle, also opens event streams for downloads, builds, log tails, and the in-browser terminal.


Configuration

There is one runtime config file: config/llm-systems.toml. Both the manager and the alarm engine read from it. A documented template ships as config/llm-systems.toml.example — the installer renders the live file from the template and prompts you for the values that have to be host-specific (IPs, SMTP credentials, InfluxDB tokens).

Edit the config, then restart the affected service:

sudo systemctl restart llm-systems-manager
# or
sudo systemctl restart llm-systems-alarm-engine

Per-agent settings live in agent/agent_config.yaml on each agent host.


Updating

Re-running the installer is safe: existing configs are backed up with a timestamp before any rewrite, and existing virtual environments are reused.

For an in-place update of an installed host:

# Detect, diff, back up, sync only what changed, restart affected services
sudo bash /opt/llm-systems-manager/tools/installer/install.sh --update

Or pick mode 7 (Update) from the interactive menu. Update preserves the run-as user that was already in place — you don’t need to re-pass --user.


Supported platforms

The manager, alarm engine, and InfluxDB are tested on Debian and Ubuntu derivatives.

The installer checks for: python3 (≥ 3.10), python3-venv, git, jq, curl, and rsync.


Troubleshooting and Uninstall

Symptom Where to look
Dashboard won’t load / 502 in the browser sudo systemctl status llm-systems-manager then sudo journalctl -u llm-systems-manager -n 100 --no-pager.
Host doesn’t appear in the dashboard Agent installed but not approved: Admin → Agents → Approve. Approved but no data: check the agent log with sudo journalctl -u llm-systems-agent -f on that host.
Agent shows up but metrics are flat The agent is probably not reaching the alarm engine. On the agent host: curl -i http://<manager-host>:8081/health (or https://... if AE TLS is on). 401 means the agent doesn’t have the ingest token yet — wait one heartbeat (≤60 s) or restart it.
Alarm engine red dot in the Admin tab Open http://<manager-host>:5000/api/admin/system-health to see which component is degraded. Common causes: AE TLS cert missing on a split multi server install (copy ae-tls.{crt,key} from manager → AE host ../data directory), ingest token mismatch (both hosts must carry the same value), InfluxDB down.
Need to start over bash /opt/llm-systems-manager/tools/installer/install.sh --uninstall walks through removing services, the install tree, the runtime user, and (with confirmation) InfluxDB itself.

Project layout

llm-systems-manager/        Flask manager — backend/ (auth, multi-user management, agent registry, terminal, reverse proxies, OpenClaw analytics, shared app context, internal CA, archive) and frontend/ (single-page UI)
agent/                      Cross-platform telemetry + control agent (+ install/)
llm-systems-alarm-engine/   Standalone alarm engine (FastAPI)
config/                     Unified TOML config + typed loader
tools/                      Universal installer (tools/installer/), smoke tests, benchmark harness
docs/                       Architecture notes, prereqs, screenshots

Contributing / Donations

Issues and pull requests are welcome.

If you find this project useful, please consider leaving a donation

Buy Me A Coffee


License

GNU Affero General Public License v3.0 — full text in the LICENSE file at the repo root.